

Having a flexible data sampling rate is a powerful feature that opens up a lot of testing and analysis possibilities.
But what does data sampled at 1,000 Hz look like? And what’s really the difference between 10 Hz, 100 Hz and 1,000 Hz?
In this article we will demonstrate the different levels of precision and analysis that are possible with data measured at each of these resolutions.
Table of Contents:
- Do you need a high sampling rate
- Sampling rate by application
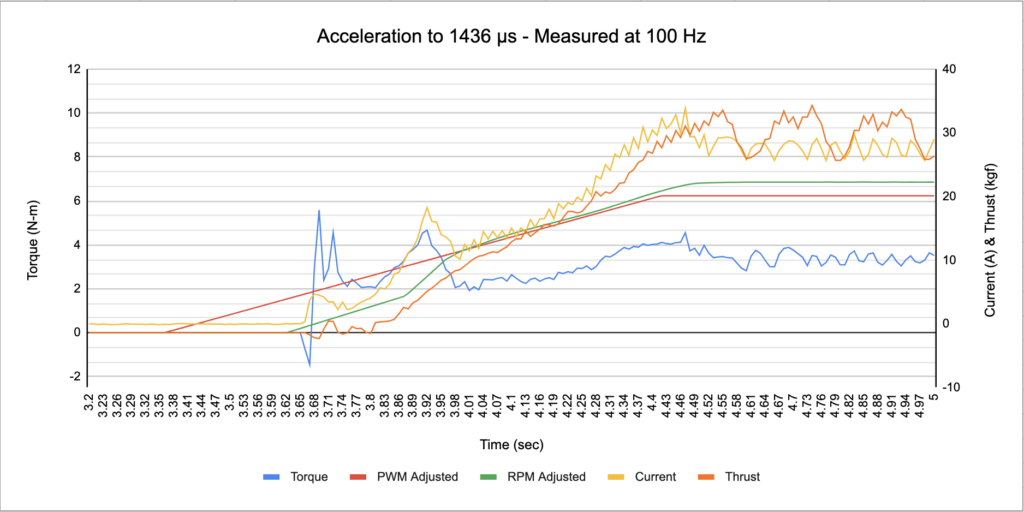
- Data comparison at 10, 100, and 1,000 Hz
- Torque and current fluctuations
- Vibration
- Motor and ESC reaction time